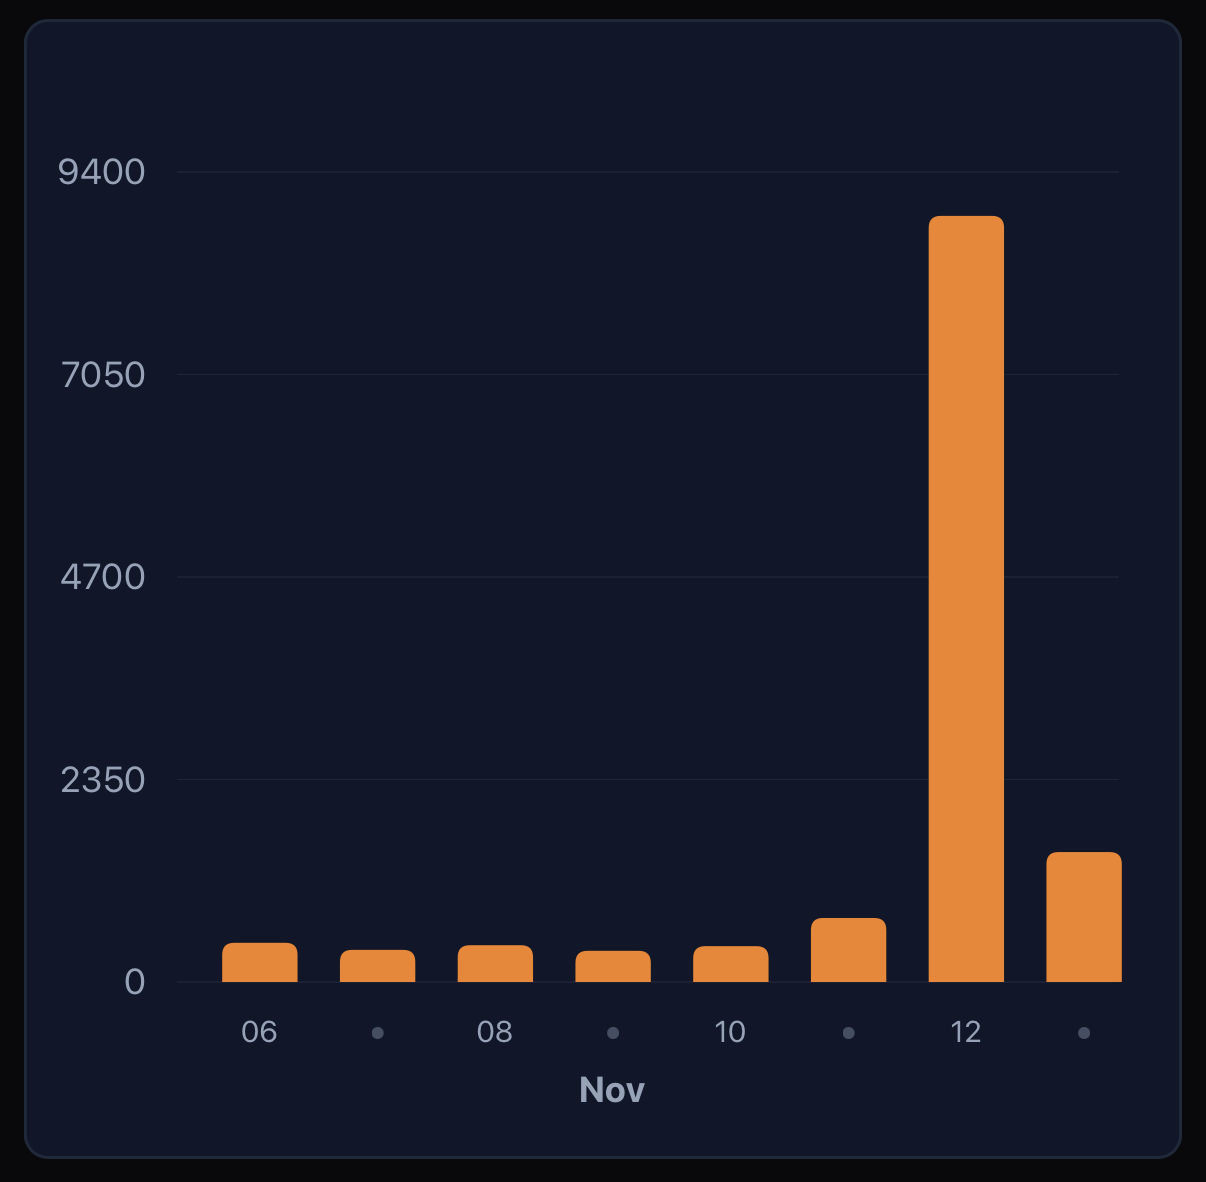
@jarrod If you’re curious about what being (briefly) on the front page of Hacker News does for page views, it was about 3 weeks of views in one day for me. 🤷♂️
 Jarrod Blundy
@jarrod If you’re curious about what being (briefly) on the front page of Hacker News does for page views, it was about 3 weeks of views in one day for me. 🤷♂️